Hoshang Mehta
How to Build Your First Data View in Pylar
Most teams start building AI agents by connecting them directly to databases. It feels fast—just paste a connection string and you're done. But here's what I've learned: that approach creates problems that compound over time. Security gaps, compliance headaches, and agents making expensive mistakes.
There's a better way. Instead of giving agents raw database access, you create data views—governed SQL queries that define exactly what agents can see. This tutorial will walk you through building your first view in Pylar, from connecting a data source to setting up basic access controls. By the end, you'll have a working view that an AI agent can safely query, and you'll understand why this approach prevents the costly mistakes we've seen teams make.
Why This Approach Works
Before we dive into the steps, let me explain why Pylar focuses on "Data → Views → Tools → Agents" instead of letting agents query databases directly.
The Problem with Direct Access
When you give an AI agent direct database access, you're giving it the keys to everything. The agent can query any table, any column, any row. It might accidentally expose sensitive data, write inefficient queries that slow down your database, or violate compliance requirements. And here's the kicker: you won't know what went wrong until it's too late.
I've watched teams spend weeks debugging why their agents are returning wrong data, only to discover the agent was joining tables incorrectly or pulling data from the wrong time period. By the time they fix it, they've lost trust and wasted engineering time.
Why Views Solve This
Views are SQL queries that you define and control. They're like windows into your data—agents can only see what you let them see through those windows. This gives you:
- Security by design: Agents can't access tables or columns you haven't included in a view
- Fine-grained control: You decide exactly what data is available, down to specific rows and columns
- Built-in governance: Every query goes through your view, so you have a complete audit trail
- Performance protection: You can optimize your views for common query patterns, preventing agents from writing slow queries
In Pylar, views are the only access level agents get. They never touch your raw database tables. This might sound restrictive, but it's actually liberating—you can iterate on views without worrying about breaking production systems or exposing sensitive data.
How Views Fit into the Bigger Picture
Views are the foundation of Pylar's approach. Once you have a view, you can:
- Create MCP tools on top of it (tools define how agents interact with the view)
- Publish those tools to any agent builder (OpenAI, LangGraph, Claude Desktop, etc.)
- Monitor how agents use your data with Evals
But it all starts with the view. Get the view right, and everything else becomes easier.
Step-by-Step Guide
Let's build your first view. I'll walk you through each step, and we'll create a simple but practical example: a customer support view that shows active customers with their basic information.
Prerequisites
Before we start, make sure you have:
- ✅ A Pylar account (if you don't have one, sign up at pylar.ai)
- ✅ A data source you want to connect (we'll use PostgreSQL as an example, but this works with BigQuery, Snowflake, MySQL, and more)
- ✅ Database credentials (host, port, database name, username, password)
- ✅ Ability to whitelist IP addresses (Pylar's IP is
34.122.205.142)
If you haven't connected a data source yet, we'll cover that in the next section. If you already have connections set up, you can skip ahead to "Creating Your First View."
Step 1: Connect Your Data Source
The first step is connecting your database to Pylar. This is a one-time setup that takes about 5 minutes.
-
Navigate to Connections: In your Pylar workspace, click on "Connections" in the left sidebar. You'll see a list of available data sources.
-
Select Your Database: Click on your database type (PostgreSQL, MySQL, BigQuery, Snowflake, etc.). A connection setup screen will appear.
-
Enter Connection Details: You'll need:
- Host: Your database hostname or IP address
- Port: The port number (defaults: PostgreSQL
5432, MySQL3306) - Database Name: The name of the database you want to connect to
- Username: Your database username
- Password: Your database password
Pro tip: Create a dedicated database user for Pylar with read-only permissions. This limits what Pylar can access and makes it easier to audit.
-
Whitelist Pylar's IP: This is critical. Pylar's IP address is
34.122.205.142. You need to whitelist this IP in your database firewall settings. Without this, Pylar won't be able to connect.For PostgreSQL, you might add a rule like:
host all pylar_user 34.122.205.142/32 md5 -
Test the Connection: Click "Test Connection" to verify everything works. If it fails, double-check your credentials and firewall settings.
-
Wait for Indexing: After the connection succeeds, Pylar will index your database schema. This usually takes a few minutes. You'll get an email notification when it's complete.
Once indexing is done, you're ready to create views. The connection will appear in your datasource dropdown when you're writing SQL queries.
Step 2: Create a New View
Now let's create your first view. We'll start simple: a view that shows active customers with their basic information.
-
Navigate to Your Project: In Pylar, views are organized within projects. If you don't have a project yet, create one. Projects help you organize related views and tools together.
-
Click "Create View": In your project, click "Create View" or "New View". The SQL IDE will appear in the center of your screen.
-
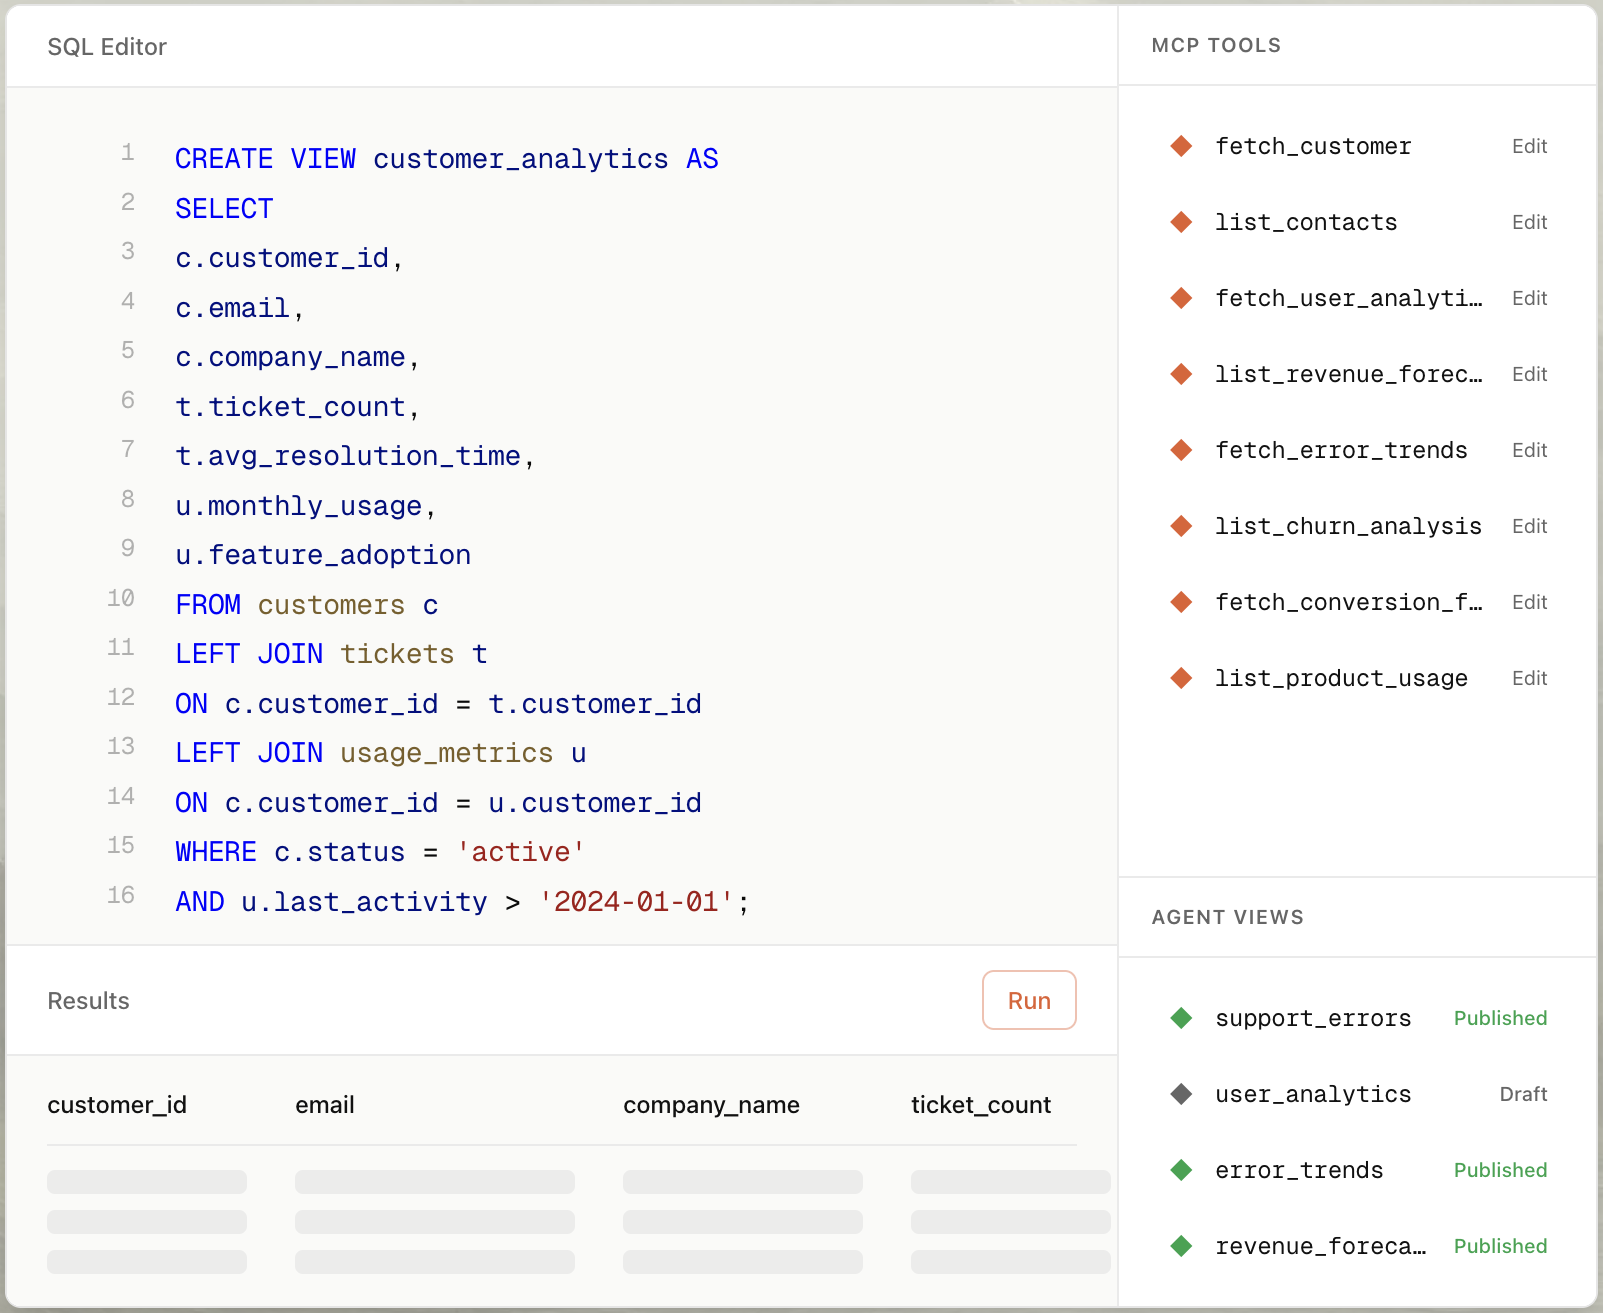
Familiarize Yourself with the SQL IDE: The SQL IDE has a few key components:
- Datasource Selector: A dropdown at the top where you select which data source to query
- SQL Query Editor: The main editing area where you write your SQL
- Run Query Button: Located in the top right, executes your query
- Query Results Panel: Shows the results below the editor

Step 3: Select Your Data Source
Before writing your query, you need to tell Pylar which data source to use.
-
Click the Datasource Dropdown: Above the SQL editor, you'll see a dropdown labeled "Select Datasource."
-
Choose Your Connection: Select the database connection you set up in Step 1. If you just connected it, it should appear in the list.
-
Navigate to Your Table (if needed): Depending on your database, you might need to navigate to a specific schema or database. The dropdown will show the structure of your connected database.
Step 4: Write Your First Query
Let's write a simple query to get started. We'll create a view that shows active customers with their basic information.
Here's a basic example:
SELECT
  customer_id,
  customer_name,
  email,
  created_at,
  subscription_status
FROM customers
WHERE is_active = true
ORDER BY created_at DESC;
What this query does:
- Selects specific columns (not
SELECT *—we'll talk about why this matters) - Filters to only active customers
- Orders by creation date, newest first
A few things to notice:
- We're only selecting the columns we need. This is a best practice—don't expose more data than necessary.
- We're filtering with
WHERE is_active = true. This limits what the agent can see. - We're using standard SQL. Pylar supports whatever SQL your database supports.
Step 5: Run and Test Your Query
Before saving this as a view, let's make sure it works.
-
Review Your Query: Double-check the SQL for any typos or mistakes.
-
Click "Run Query": Click the "Run Query" button in the top right of the SQL IDE.
-
Wait for Results: You'll see a loader while Pylar executes the query. For large datasets, this might take a few moments.
-
Review the Results: Once the query completes, you'll see:
- A data table with your results
- The row count (how many rows were returned)
- The last run time
- Execution metadata
Check that:
- The row count makes sense (not too many, not zero)
- The data looks correct
- The columns are what you expected
If something looks wrong, adjust your query and run it again. The SQL IDE makes it easy to iterate.
Step 6: Refine Your Query (Optional)
Once you have a working query, you might want to refine it. Here are some common improvements:
Add a date filter (for compliance or performance):
SELECT
  customer_id,
  customer_name,
  email,
  created_at,
  subscription_status
FROM customers
WHERE is_active = true
  AND created_at >= DATE_SUB(CURRENT_DATE(), INTERVAL 2 YEAR)
ORDER BY created_at DESC;
Add a limit (for testing or performance):
SELECT
  customer_id,
  customer_name,
  email,
  created_at,
  subscription_status
FROM customers
WHERE is_active = true
ORDER BY created_at DESC
LIMIT 1000;
Exclude sensitive columns: Make sure you're not selecting columns with PII, financial data, or internal notes unless the agent actually needs them.
Run the query again to make sure it still works with your changes.
Step 7: Save Your View
Once you're happy with the query, save it as a view.
-
Click "Save View": You'll see a "Save View" or "Save" button in the SQL IDE.
-
Enter a Descriptive Name: Give your view a clear, descriptive name. For example:
active_customers_vieworcustomer_support_view.Naming tips:
- Use lowercase with underscores (snake_case)
- Be specific about what the view contains
- Include the purpose if it's not obvious (e.g.,
customer_support_viewvs.customers)
-
Add a Description (optional but recommended): Add a description that explains what this view is for and what data it contains. This helps your team understand the view later.
Example:
Active customers view for support agents. Includes customer ID, name, email, creation date, and subscription status. Filters to active customers only.
-
Click "Save": Your view is now saved in your project.
Congratulations! You've created your first data view. This view is now available for you to build MCP tools on top of, which agents can then use to query your data safely.
Real-World Examples
Let me show you how different teams would use this approach in practice.
Example 1: Customer Support Team
A customer support team needs an agent that can quickly look up customer information when someone calls in. Instead of giving the agent access to the entire customers table (which might include internal notes, credit scores, or financial data), they create a view like this:
SELECT
  customer_id,
  customer_name,
  email,
  phone,
  subscription_status,
  last_login_date,
  signup_date
FROM customers
WHERE is_active = true;
The agent can answer questions like:
- "What's the subscription status for customer@example.com?"
- "When did this customer last log in?"
- "How long has this customer been with us?"
But it can't access sensitive data like payment information or internal notes. The view acts as a security boundary.
Example 2: Sales Team
A sales team wants an agent that can help prepare for customer meetings. They create a view that combines customer data with order history:
SELECT
  c.customer_id,
  c.customer_name,
  c.email,
  c.subscription_status,
  COUNT(o.order_id) AS total_orders,
  SUM(o.amount) AS total_revenue,
  MAX(o.order_date) AS last_order_date
FROM customers c
LEFT JOIN orders o ON c.customer_id = o.customer_id
WHERE c.is_active = true
GROUP BY c.customer_id, c.customer_name, c.email, c.subscription_status;
The agent can answer:
- "What's the total revenue for this customer?"
- "How many orders have they placed?"
- "When was their last order?"
This view gives the sales team the context they need without exposing the entire database.
Example 3: Product Team
A product team wants to understand user engagement. They create a view that shows user activity:
SELECT
  user_id,
  email,
  signup_date,
  last_active_date,
  feature_usage_count,
  CASE
    WHEN last_active_date >= DATE_SUB(CURRENT_DATE(), INTERVAL 7 DAY) THEN 'Active'
    WHEN last_active_date >= DATE_SUB(CURRENT_DATE(), INTERVAL 30 DAY) THEN 'Dormant'
    ELSE 'Inactive'
  END AS engagement_status
FROM users
WHERE signup_date >= DATE_SUB(CURRENT_DATE(), INTERVAL 1 YEAR);
The agent can help answer:
- "What percentage of users are active?"
- "Which users haven't logged in recently?"
- "How does engagement vary by signup date?"
Notice how each view is tailored to a specific use case. That's the power of views—you create exactly what each team needs, nothing more.
Common Pitfalls & Tips
I've seen teams make these mistakes when building their first views. Here's how to avoid them.
Pitfall 1: Using SELECT *
It's tempting to use SELECT * when you're exploring data, but don't do it in production views. Here's why:
- Security risk: You might accidentally expose sensitive columns you didn't know existed
- Performance: Selecting all columns is slower and uses more bandwidth
- Clarity: Explicit column lists make it clear what data the view contains
Instead: List every column you need explicitly. It's a bit more typing, but it's worth it.
Pitfall 2: Not Filtering Data
If your customers table has 10 million rows but you only need active customers from the last year, filter early:
-- Good: Filter in the WHERE clause
SELECT customer_id, email
FROM customers
WHERE is_active = true
  AND created_at >= DATE_SUB(CURRENT_DATE(), INTERVAL 1 YEAR);

-- Bad: No filtering, returns everything
SELECT customer_id, email
FROM customers;
Why this matters: Unfiltered views can return massive amounts of data, slowing down queries and potentially exposing data you didn't intend to expose.
Pitfall 3: Including Sensitive Data
Before saving a view, ask yourself: "Does the agent actually need this column?" If the answer is no, remove it.
Common columns to exclude:
- Credit card numbers
- Social security numbers
- Passwords or password hashes
- Internal notes or comments
- Financial data (unless specifically needed)
- Personal addresses (unless needed for the use case)
Tip: Start narrow. You can always add columns later if the agent needs them.
Pitfall 4: Not Testing with Real Data
Always test your view with real data before building tools on top of it. I've seen teams create views that work in development but fail in production because:
- The data types are different
- There are NULL values they didn't account for
- The data volume is much larger than expected
How to test:
- Run the query in the SQL IDE
- Check the row count (does it make sense?)
- Look at a few sample rows (does the data look correct?)
- Test edge cases (what if a customer has no orders? What if email is NULL?)
Pitfall 5: Not Documenting Your View
Views are code, and code needs documentation. When you save a view, add a description that explains:
- What the view is for
- What data it contains
- Any important filters or assumptions
- Who should use it
This saves time later when someone (maybe you, six months from now) needs to understand what the view does.
Best Practices Summary
Here's a quick checklist for building good views:
- ✅ Explicit column lists: Never use
SELECT * - ✅ Filter early: Use WHERE clauses to limit data
- ✅ Exclude sensitive data: Only include columns the agent needs
- ✅ Test thoroughly: Run queries and verify results before saving
- ✅ Name clearly: Use descriptive names that explain the view's purpose
- ✅ Document: Add descriptions that explain what the view is for
- ✅ **Start narro
Frequently Asked Questions
Do I need to know SQL to create views?
Yes, views are SQL queries, so you need to know SQL. But you don't need to be a SQL expert. If you can write basic SELECT statements with WHERE clauses, you can create useful views. Pylar's SQL IDE includes syntax highlighting and auto-completion to help.
Can I update a view after I've created it?
Yes! You can edit a view anytime. When you update a view, all tools and agents that use it automatically get the updated version. This is one of the benefits of the views approach—you can iterate without redeploying code.
What if I need to join data from multiple databases?
Pylar supports cross-database joins. You can join data from PostgreSQL, Snowflake, HubSpot, and more—all in a single query. Just reference tables using the format datasource.schema.table. We'll cover this in a future tutorial.
How do I know if my view is working correctly?
Use Pylar's Evals system. Once you've built tools on your view and connected them to agents, Evals shows you:
- How often queries succeed vs. fail
- What errors occur and why
- What types of queries agents are making
- Raw query logs for debugging
This visibility helps you identify problems and optimize your views.
Can I create multiple views from the same table?
Absolutely. In fact, this is a best practice. Create different views for different use cases. For example:
customer_support_viewfor support agents (basic info only)customer_sales_viewfor sales teams (includes revenue data)customer_analytics_viewfor analytics (includes engagement metrics)
Each view exposes only what that team needs.
What if my query is slow?
If your view queries are slow, try:
- Adding filters to reduce the data volume
- Using LIMIT for testing (but remove it in production if you need all data)
- Adding indexes to your database (if you have control)
- Using aggregated subqueries instead of joining large tables
Pylar executes queries on your database infrastructure, so query performance depends on your database setup.
How do I connect this view to an AI agent?
First, you need to create an MCP tool on top of the view. Then you publish the tool to get an MCP server URL and authorization token. Finally, you paste those credentials into your agent builder (OpenAI, LangGraph, Claude Desktop, etc.). We'll cover this in detail in the next tutorial: "How to Build Your First MCP Tool on a Data View."
Next Steps
You've built your first data view. That's the foundation. Now you can:
-
Create more views: Build views for different use cases, different teams, or different data sources.
-
Build MCP tools: Turn your view into an MCP tool that agents can actually use. The next tutorial will walk you through this.
-
Test with Evals: Once you have tools connected to agents, use Evals to see how agents are using your data and identify areas for improvement.
-
Iterate: Views aren't set in stone. As you learn how agents use your data, you can refine your views to better match their needs.
The key is to start simple and iterate. Your first view doesn't need to be perfect—it just needs to work. You can always refine it later based on real usage.
If you want to keep going, the next step is building your first MCP tool on this view. That's where the magic happens—turning your governed data into tools that agents can actually use.